Grade 3 Unit 5:
Representing & Comparing Fractions
Unit 5 Parent Letter
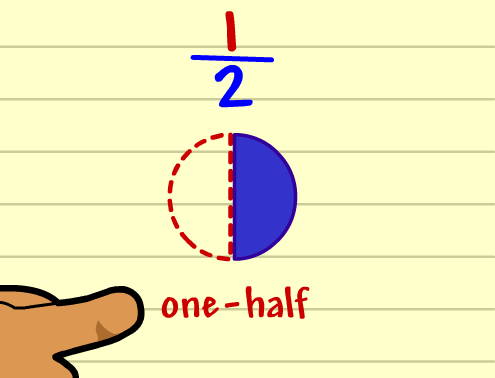
Introduction to Fractions
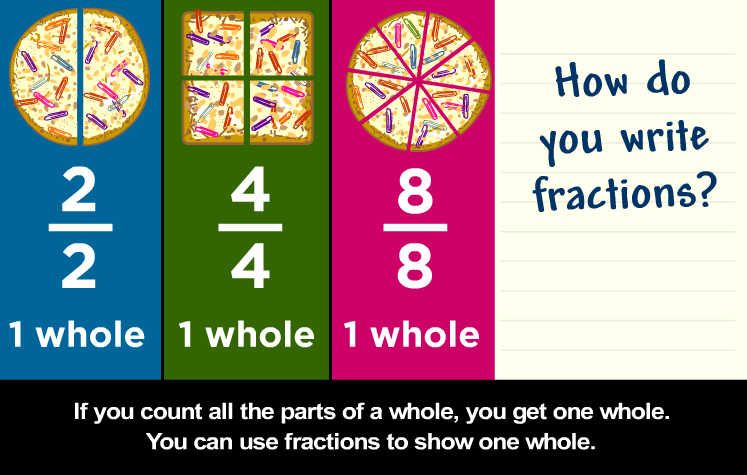
MGSE3.NF.1 Understand a fraction 1 𝑏 as the quantity formed by 1 part when a whole is partitioned into b equal parts (unit fraction); understand a fraction 𝑎 𝑏 as the quantity
|
|
|
3.
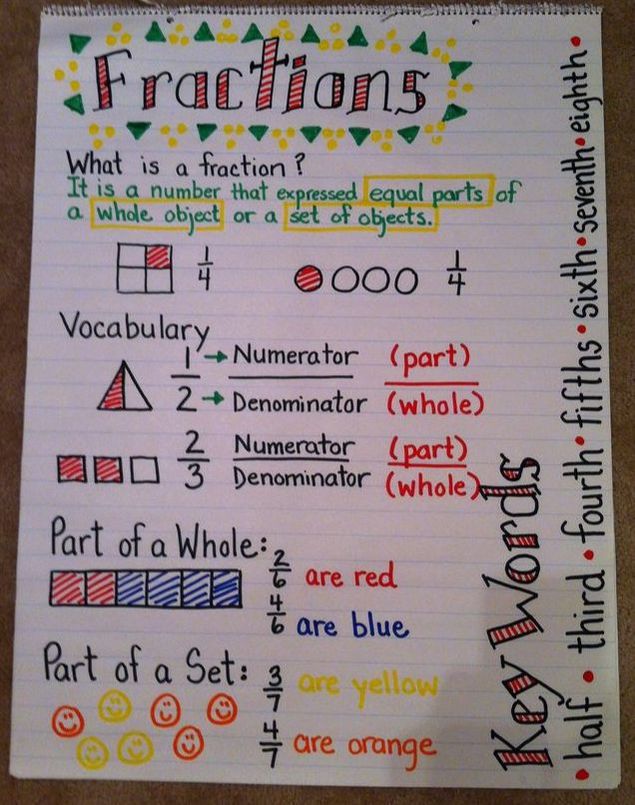
Part of Whole or Part of Set |
|
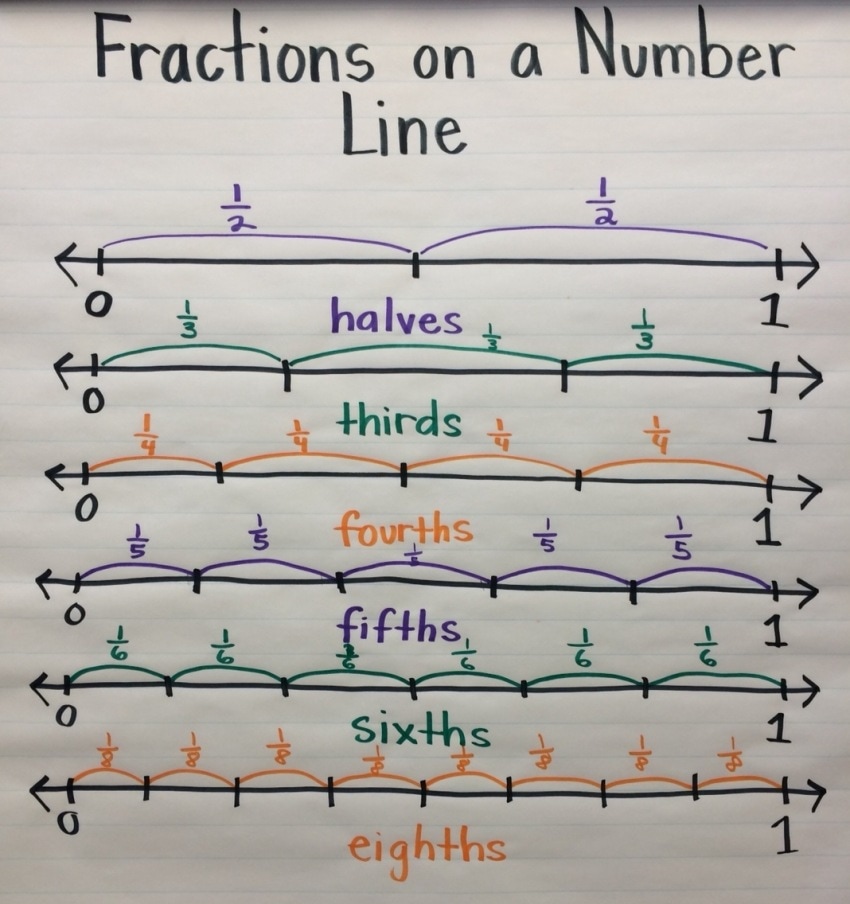
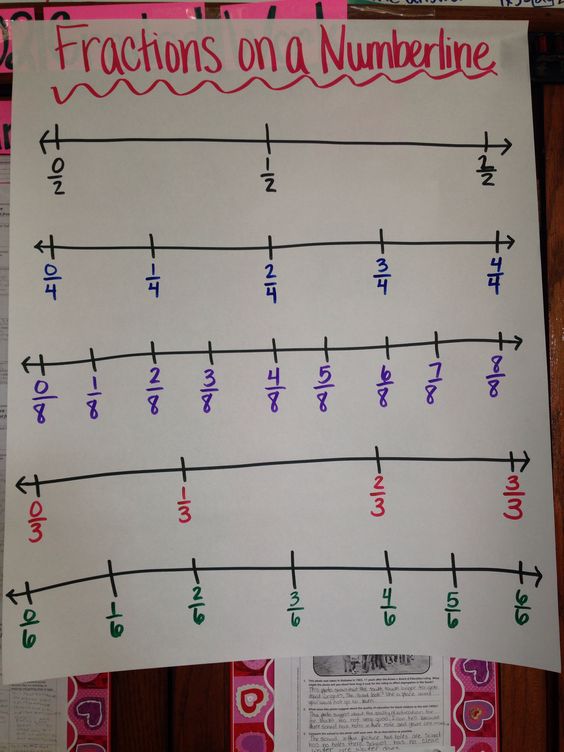
Fractions on a Number Line
MGSE3.NF.2 Understand a fraction as a number on the number line; represent fractions on a number line diagram.
a. Represent a fraction 1 𝑏 on a number line diagram by defining the interval from 0 to 1 as the whole and partitioning it into b equal parts. Recognize that each part has size 1 𝑏 . Recognize that a unit fraction 1 𝑏 is located 1 𝑏 whole unit from 0 on the number line.
b. Represent a non-unit fraction 𝑎 𝑏 on a number line diagram by marking off a lengths of 1 𝑏 (unit fractions) from 0. Recognize that the resulting interval has size 𝑎 𝑏 and that its endpoint locates the non-unit fraction 𝑎 𝑏 on the number line.
|
4.
Setting Up A Number Line 1. Show benchmark numbers 0 and 1 on number line. 2. The denominator is the number of SPACES you want between 0 and 1. 3. Each space should be the same size. |
|
|
5.
Labeling A Number Line Numerators go in order from left to right. |
|
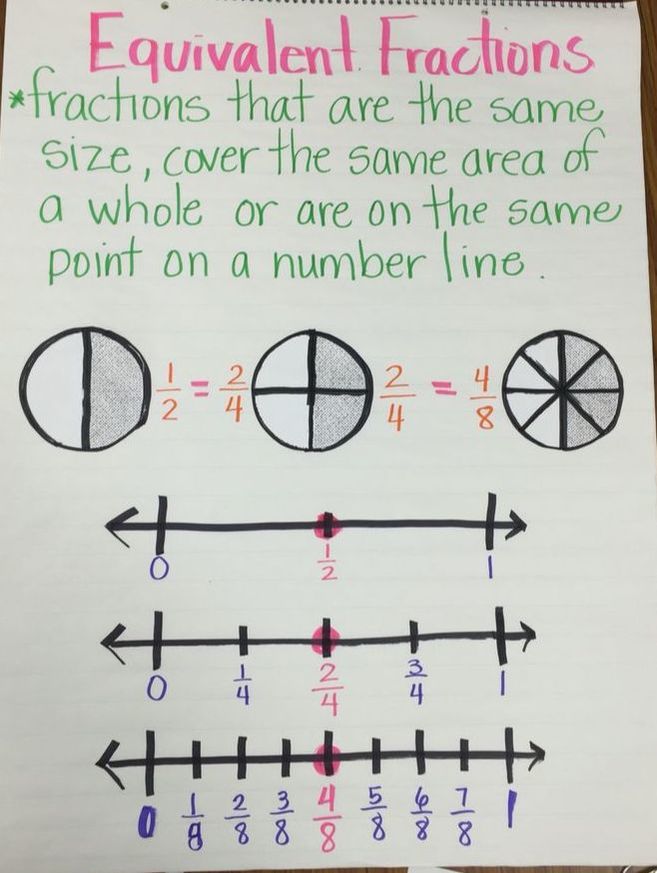
Equivalent Fraction Models
MGSE3.NF.3 Explain equivalence of fractions through reasoning with visual fraction models. Compare fractions by reasoning about their size.
a. Understand two fractions as equivalent (equal) if they are the same size, or the same point on a number line.
b. Recognize and generate simple equivalent fractions with denominators of 2, 3, 4, 6, and 8, e.g., 1/2 = 2/4 , 4 6 = 2/3 . Explain why the fractions are equivalent, e.g., by using a visual fraction model.
c. Express whole numbers as fractions, and recognize fractions that are equivalent to whole numbers. Examples: Express 3 in the form 3 = 6 2 (3 wholes is equal to six halves); recognize that 3/1 = 3; locate 4/4 and 1 at the same point of a number line diagram.
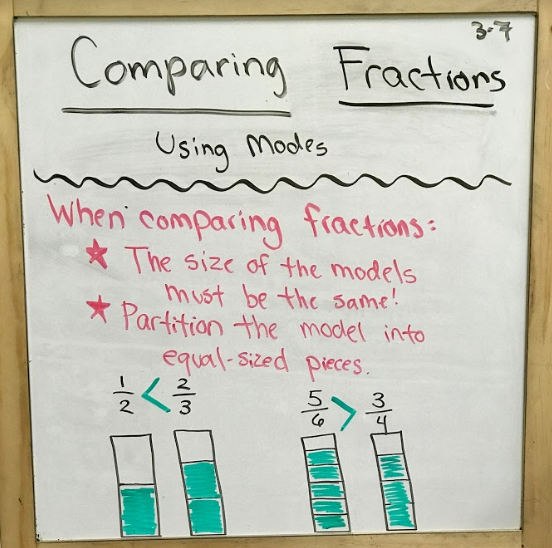
d. Compare two fractions with the same numerator or the same denominator by reasoning about their size. Recognize that comparisons are valid only when the two fractions refer to the same whole. Record the results of comparisons with the symbols >, =, or <, and justify the conclusions, e.g., by using a visual fraction model.
|
|
7.
Equivalent Fraction Models |
|
|
8.
Comparing Fractions with Models |
|
|
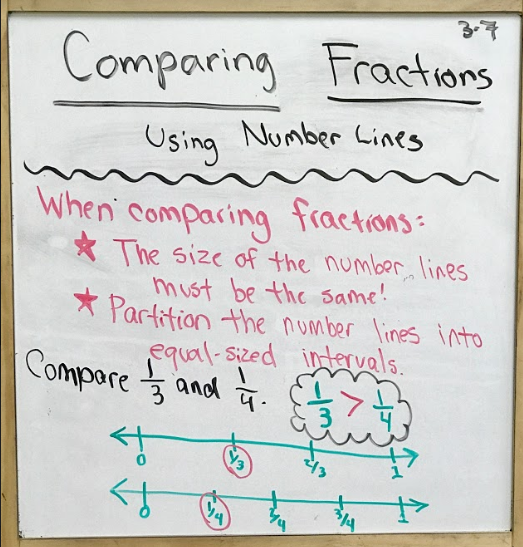
9.
Comparing Fractions with Number Lines |
|
Graphs with Fractions
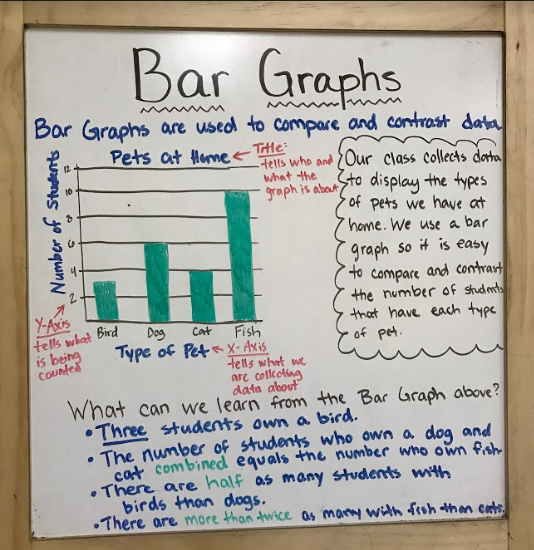
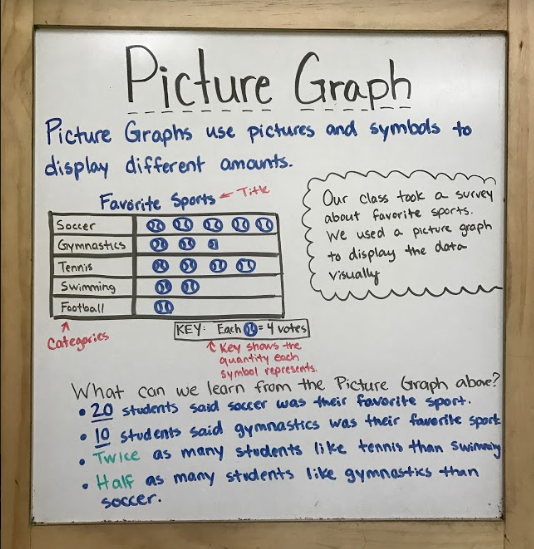
MGSE3.MD.3 Draw a scaled picture graph and a scaled bar graph to represent a data set with several categories. Solve one- and two-step “how many more” and “how many less” problems using information presented in scaled bar graphs. For example, draw a bar graph in which each square in the bar graph might represent 5 pets. |
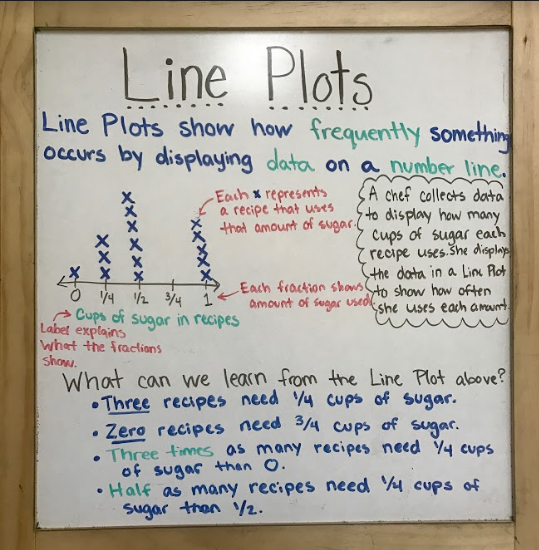
MGSE3.MD.4 Generate measurement data by measuring lengths using rulers marked with halves and fourths of an inch. Show the data by making a line plot, where the horizontal scale is marked off in appropriate units— whole numbers, halves, or quarters. |
|
10.
Types of Graphs |
|
